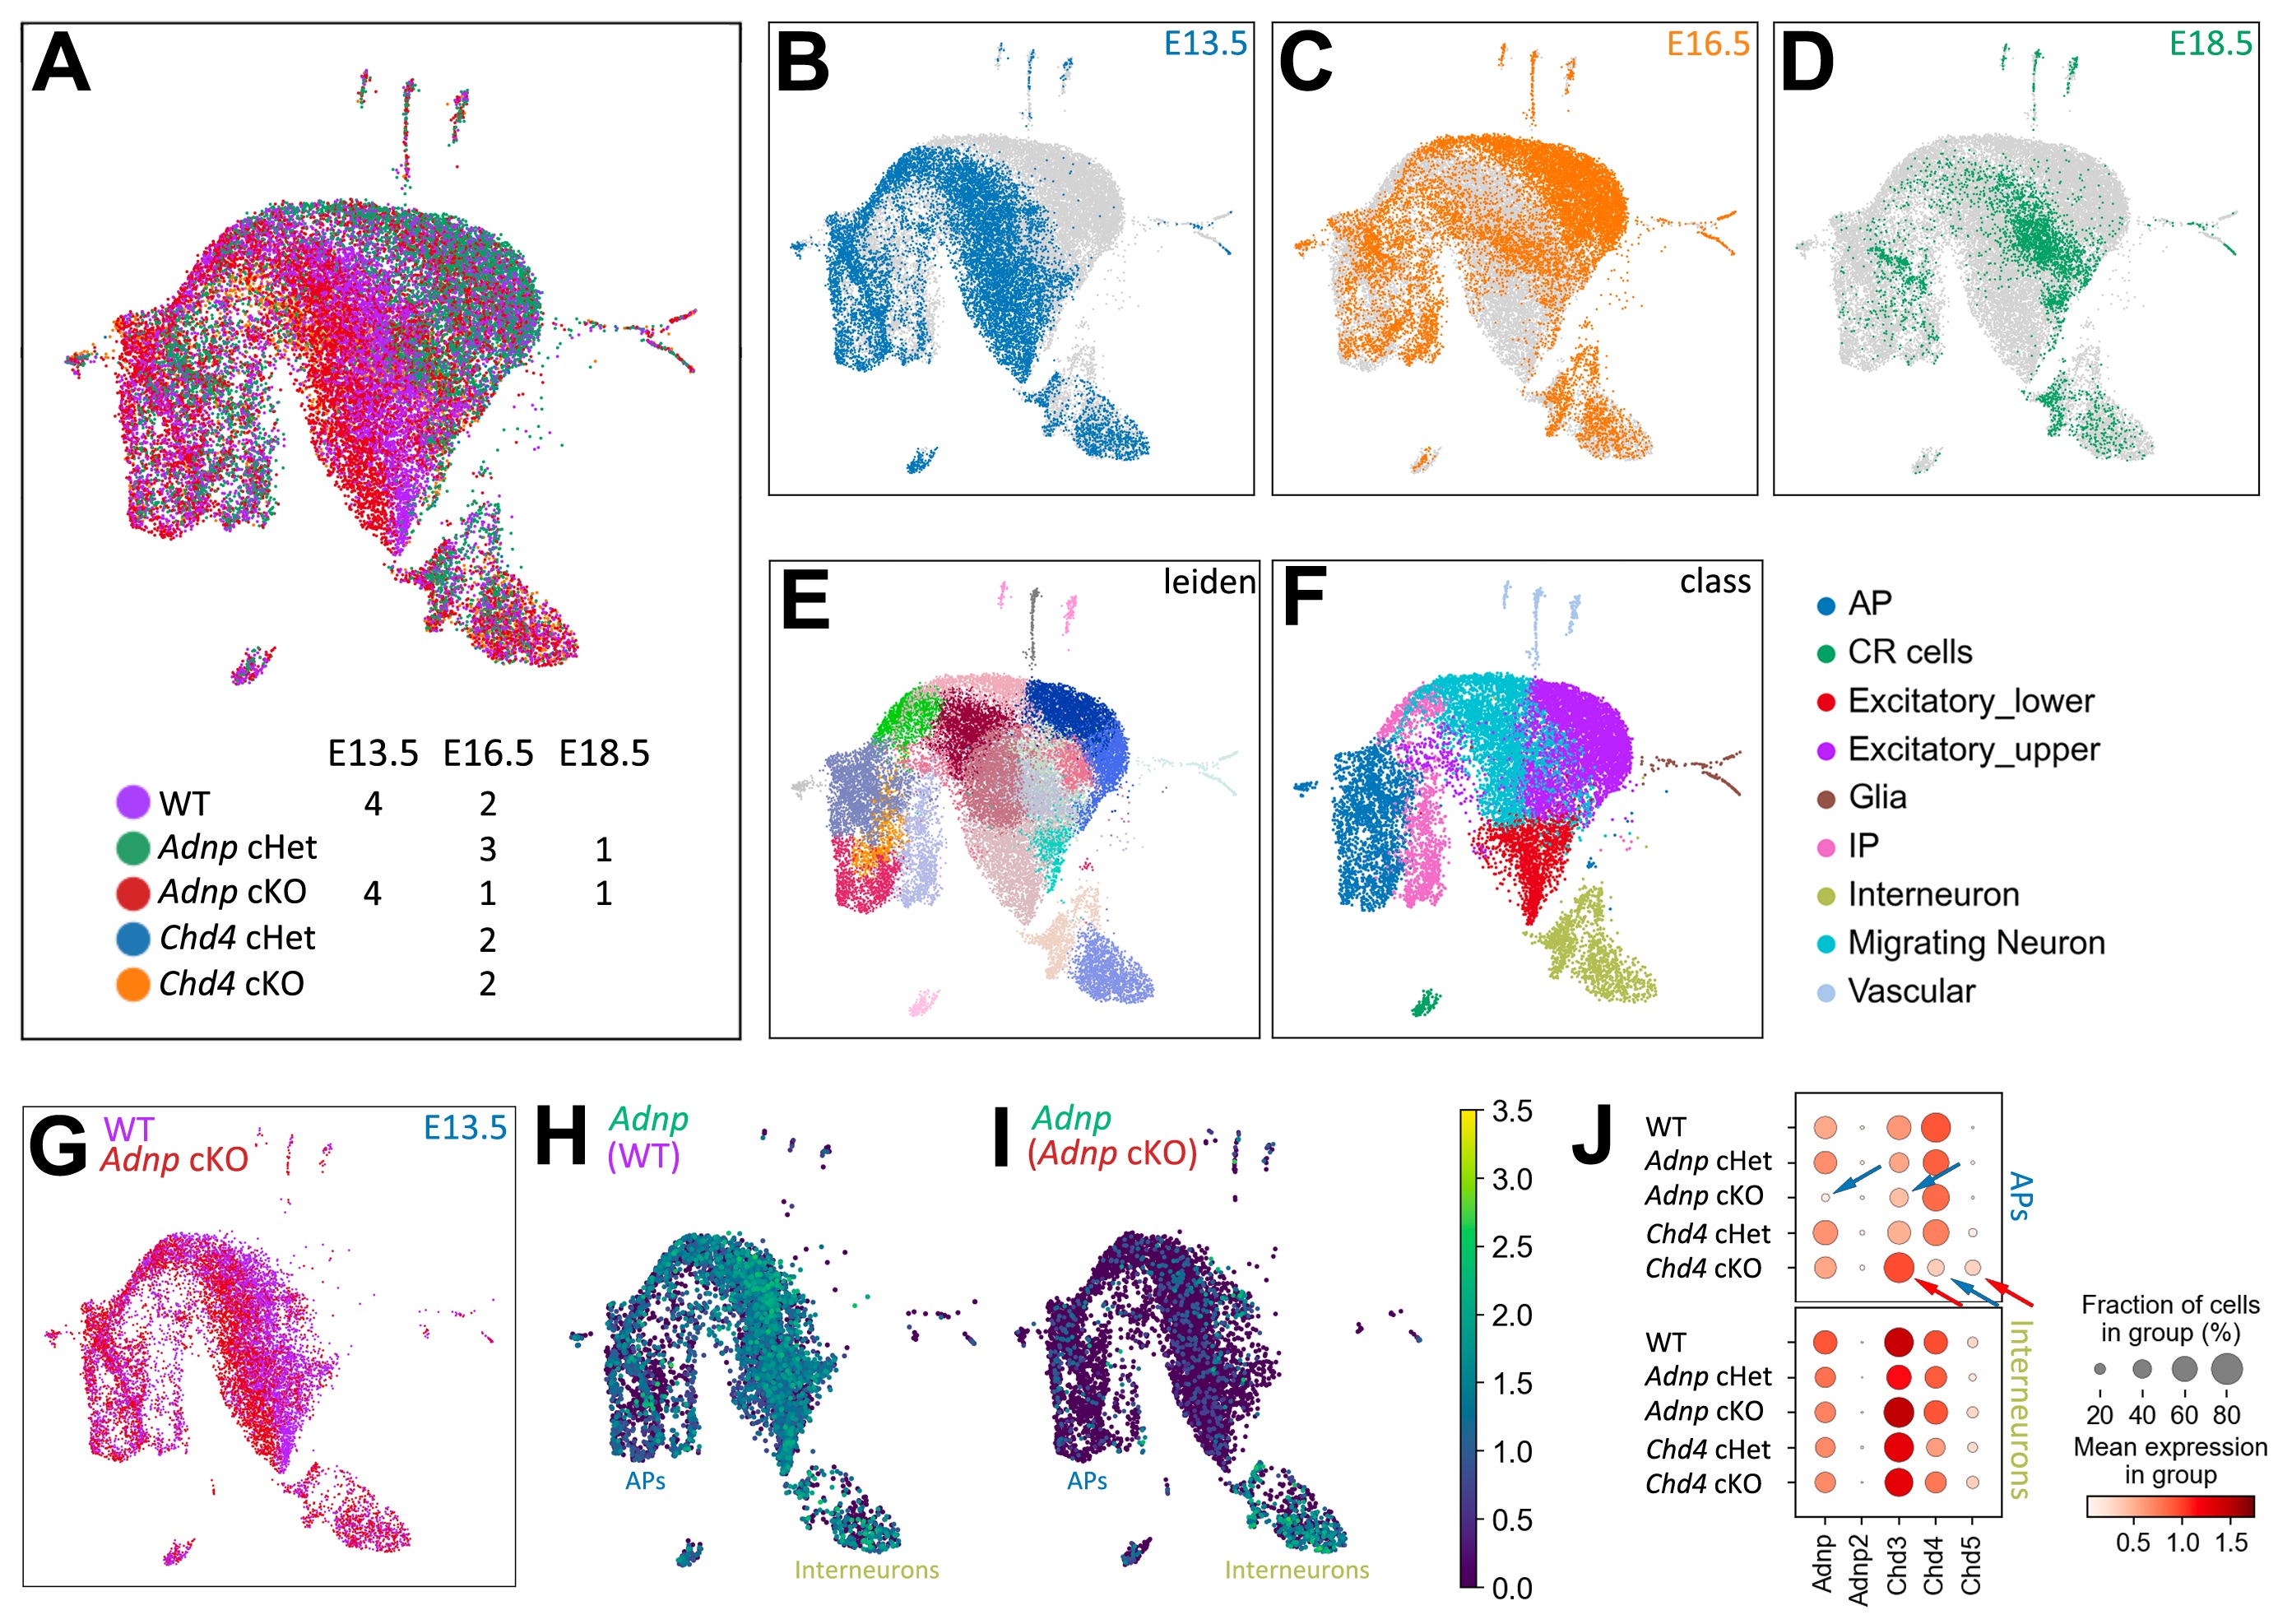
Technologies

Experimental Approaches:


1) Genetic modification of retinal progenitors.

The lab has expertise in a number of techniques to manipulate retinal progenitors both in vivo and in culture, including mouse genetics, retroviral transduction, and electroporation. Developing retinas can be explanted and grown in tissue culture, which facilitates a variety of experimental approaches.
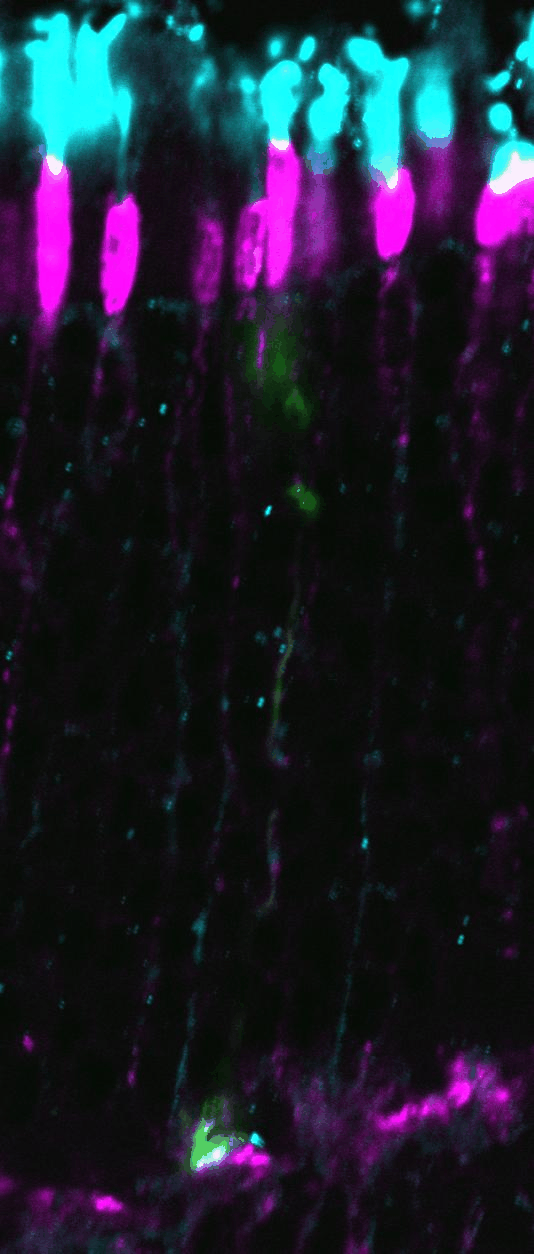
Cones and a rod (green) derived from progenitors transfected at embryonic day 14.5 via in utero retinal electroporation, and allowed to develop until postnatal day 21. Cone opsin (red) and peanut agglutinin (blue) mark the cone photoreceptors.


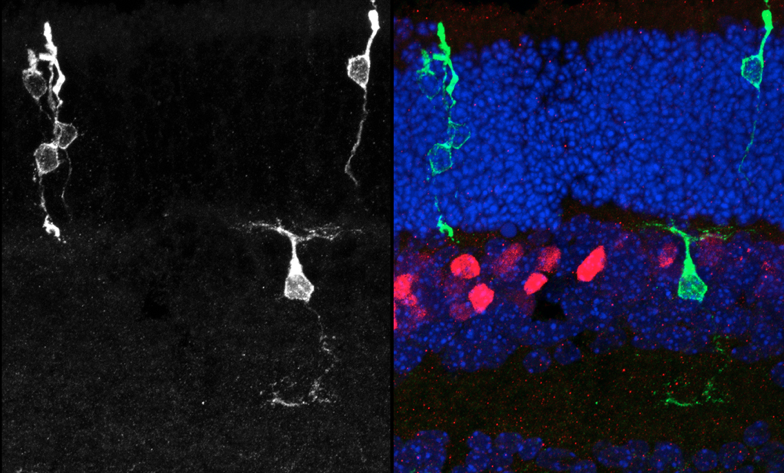
Clonal analysis allows the complete lineage generated by individual progenitor cells to be analyzed. Here, retroviral clones (green) generated from dividing progenitors transduced at postnatal day 0, and harvested 2 weeks later. Vsx2 protein staining marks bipolar cells (red), while Hoechst stains the DNA (blue), allowing the tissue to be visualized in full. The clone on the left contains 3 rods, while the clone on the right contains a rod and a bipolar cell.
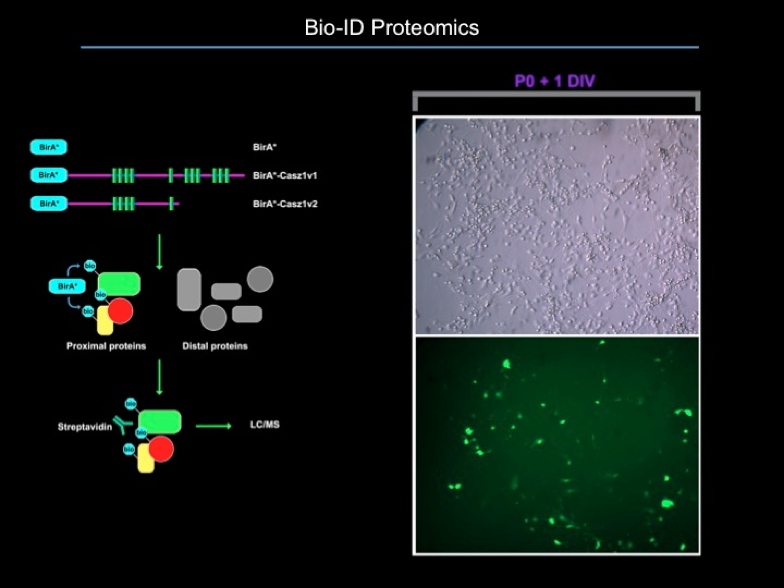


2. Proteomics

We have successfully adapted the Bio-ID technique to primary retinal cultures. This allows the lab to perform proteomics on proteins that are difficult to purify through other means.


3.  Genomics

There is already a huge number of genome-wide datasets in the repositories, and there is a correspondingly huge need for careful bioinformatic analysis of this data. We perform de novo analysis and meta-analysis using a variety of bioinformatic approaches and tools.

For generating datasets de novo, we have primarily used multi-seq - which is a multiplex single-cell RNA-seq workflow developed by Chris McGinnis and Zev Gartner: https://pubmed.ncbi.nlm.nih.gov/31209384/  

The lab also has expertise with conventional RNA-seq and ATAC-seq for the characterization of chromatin accessibility using very small amounts of input material.

For bioinformatic analysis we frequently use the following resources:
  
Bioconductor/R -   RNA-seq, Chip-seq, ATAC-seq    http://www.bioconductor.org/
Galaxy                 -   RNA-seq, Chip-seq, ATAC-seq    https://usegalaxy.org/  
IGV  - RNA-seq, Chip-seq, ATAC-seq http://software.broadinstitute.org/software/igv/
Seq-Plots            -     Chip-seq: k-means clustering      https://github.com/przemol/seqplots
Morpheus             -     RNA-seq: k-means clustering      https://software.broadinstitute.org/morpheus/    


Bioinformatic identification of functional Casz1 regulatory elements (modified from Mattar et al., https://www.ncbi.nlm.nih.gov/pubmed/25654255).  The data here are visualized using IGV. At the top (in yellow) is the genomic structure of the Casz1 genomic locus. Below are ATAC-seq and Chip-seq data from a variety of sources (in purple; see below for the source data references. Data were mapped de novo from the raw datasets). Next is a plot of evolutionary conservation, from rVista2.0 (https://rvista.dcode.org/). Next, I cloned the indicated regulatory elements upstream of GFP reporters. These reporter constructs were transfected into retinas, and GFP expression was detected.


Genomic data sources:  ATAC-seq: Mo et al. (https://www.ncbi.nlm.nih.gov/pubmed/26949250)
H3K27ac chip-seq: Mo et al., (https://www.ncbi.nlm.nih.gov/pubmed/26949250)
Crx chip-seq: Corbo et al. (https://www.ncbi.nlm.nih.gov/pubmed/20693478)
Nrl chip-seq: Hao et al. (https://www.ncbi.nlm.nih.gov/pubmed/22511886)
Otx2 chip-seq: Samuel et al. (https://www.ncbi.nlm.nih.gov/pubmed/24558479)